


Turning user intent into business speed
For the presentation
Challenge
The challenge was designing a scalable, AI-driven filtering experience that reduces complexity and friction, supports PLG growth, and accelerates decision-making across teams.
Stakeholders
As an ESM (Enterprise Service Management) product company, our stakeholders are divided into two categories.
Technical Teams
Technical implementation teams and customer IT departments are expert users. They are fluent in filtering terminology, seeking advanced capabilities, and expecting maximum control over inputs, to work faster and at scale.
Non-Technical Teams
Non-technical teams don’t think in filtering terminology. They think in questions they need answered and expect the experience to be simple, guided, and frustration-free.
Business Impact
As a premium AI capability, this feature directly impacts ARR and pricing strategy. Beyond revenue, it strengthens SysAid’s position in ITSM and ESM AI leadership - driving user effectiveness while reducing cognitive load at scale.
Evidence Before Opinion
We grounded the solution in real behavior and real voices. We interviewed users, analyzed product data, reviewed logs and recordings, and studied how people learn, struggle, and succeed; so design decisions were driven by evidence, not assumptions.
For the research, we analyzed data from our sources: Mixpanel, Userflow, and Gong.
Structuring Complexity
With 89 out-of-the-box columns, filtering complexity was unavoidable. We mapped the full data model with backend partners, then segmented it intentionally - laying the foundation for scalable, intuitive filtering powered by AI.
After we mapped everything with our backend dev, we segmented them accordingly.
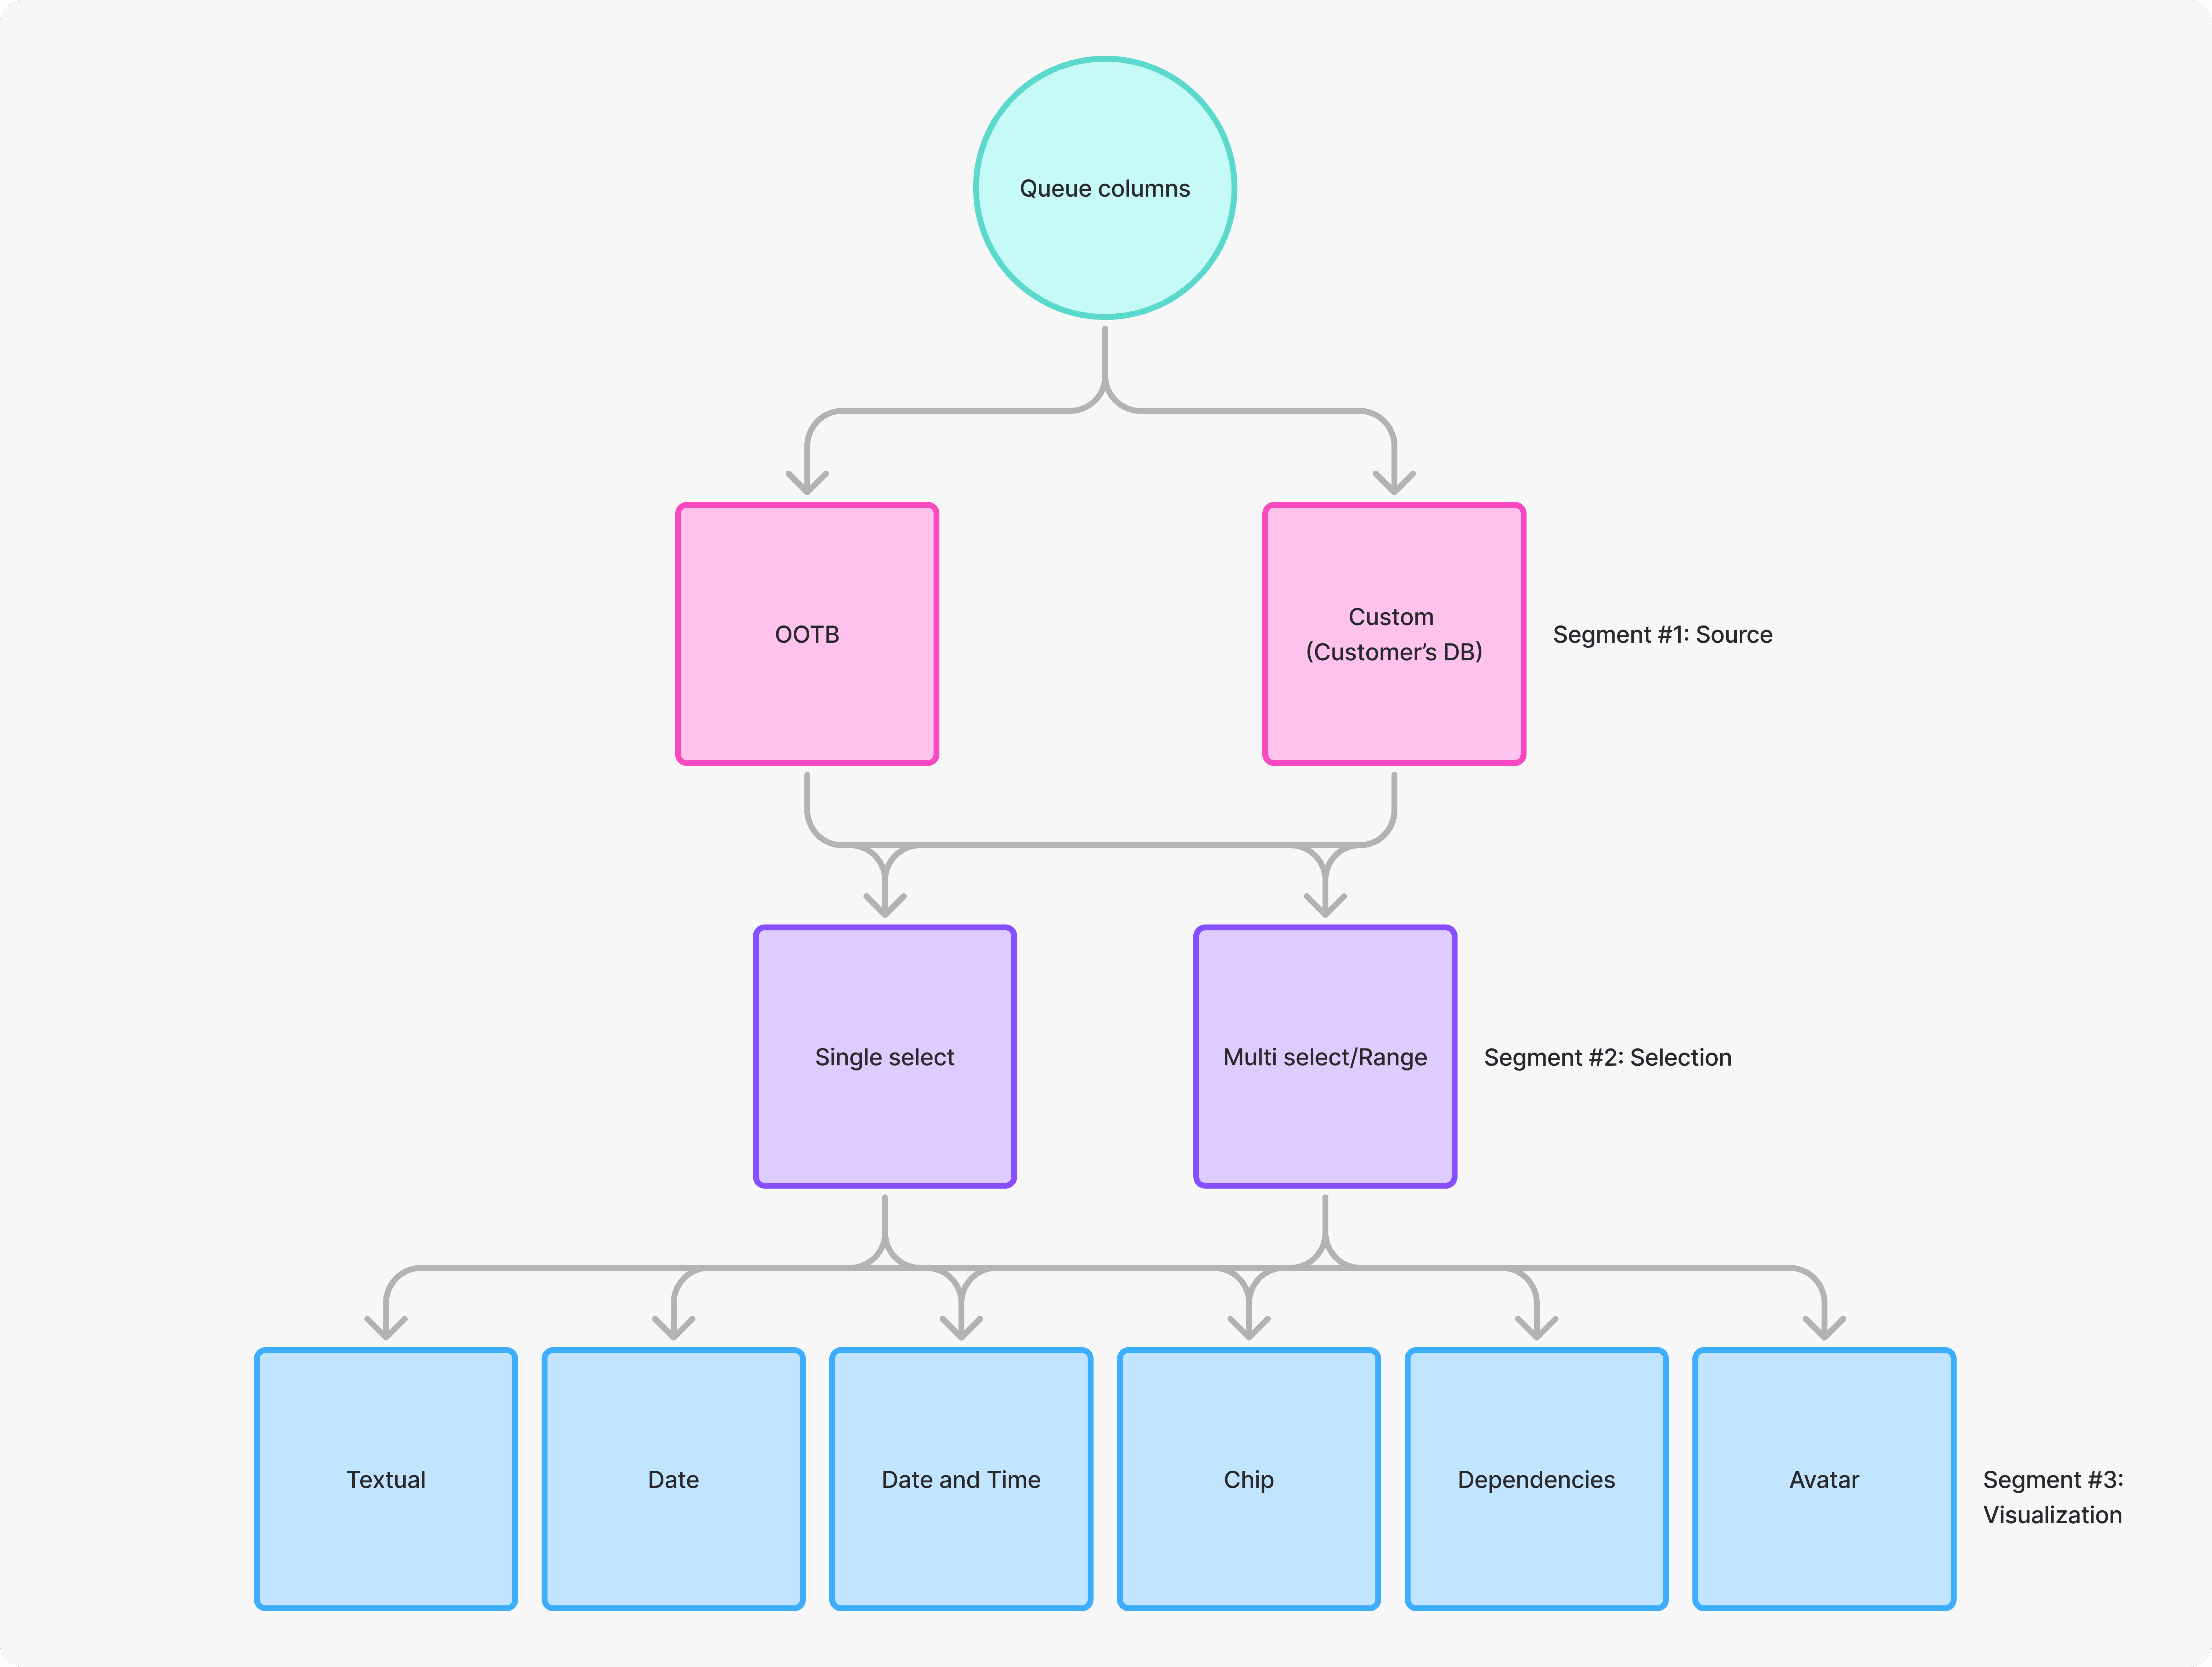
This work clarified how the manual experience should behave and gave us the structure needed to train the AI; improving accuracy, consistency, and results at scale.
KPIs and Measurements
We didn’t rely on assumptions. We defined clear KPIs to validate whether AI filtering delivered real value; for users and for the business.
AI Discoverability – Do users notice and try AI filters without guidance?
Activation – Do users reach meaningful value with their first AI-driven filter?
Adoption – Does AI filtering become part of everyday work?
AI Trust (Human-in-the-Loop) – Do users trust the AI’s results and refine them with confidence?
Churn Signals – When do users hesitate, fail, or abandon the experience?
If these moved, the experience was working.
Discoverability
Feature discovery rate: % of users who open the "Filters" popover and click into the AI Filter text box.
Activation
Time-to-Filter: The average time spent in the popover when using AI vs the average time spent manually configuring "Column + Value + Add."
Adoption
AI vs. Manual Ratio: % of total filter applications initiated via the AI prompt vs those initiated via the "Column" dropdown.
AI
Prompt Refinement Rate: % of users who submit a second AI prompt immediately after the first without closing the popover.
AI
Filter Deletion Rate: % of AI-generated filters that are deleted within 5 seconds of being applied.
Churn
"Clear All" Frequency: % of AI filter attempts that end with the user clicking "Clear all" and exiting the popover.
One Filter Hub That Tells a Story
A unified space where all filters live, revealing user intent and context in a clear, ordered flow.

AI First, Human Comfort Second
AI needed to lead the experience, but trust needed to follow.
While AI was positioned as the primary entry point, research showed that non-technical teams still relied on familiar manual controls as a confidence anchor. Removing them entirely would have increased hesitation, slowed adoption, and raised drop-off risk.
We intentionally placed manual filtering in a higher visual hierarchy. This preserved user confidence while allowing AI results to populate immediately above, reinforcing clarity and predictability.
Eye-tracking and behavior analysis confirmed consistent scan patterns from top to bottom and left to right across iterations.
Early findings from moderated focus groups were validated through unmoderated AI-assisted testing using ClarityUX, then synthesized into a single, evidence-backed decision.
The result was faster activation, higher trust, and smoother AI adoption without sacrificing control.

Streamlined Row Logic for Focused Filtering
One clean row at a time to reduce clutter and accelerate insight discovery.

Creating a visual difference between the applied rows that are affecting the table, to the ones who are yet to affect.
Increasing clarity, orientation, and lowering cognitive load.

Smart Operators, Dynamic Values
Intuitive defaults and dynamic values make filter building simple without sacrificing precision.

The value is the trickiest one, as it relies on the segments we did early on in the process.
Once a column is selected, the value is unique and linked to the selected column.

These are the value options:


The "Assignee" and "Statuses" are even trickier as they are dependencies.
Those two columns are dynamic filters built OOTB from the users' databases.


Delete Without Fear
Confident deletion design prevents mistakes and forgives missteps; lowering frustration and churn.

Layered Logic, Predictable Outcomes
Consistent cascading behavior reinforces predictability, reducing cognitive load across filter types.


I also used the same "Delight Input" in both, and the same "Thinking" experience across all AI features.


